
Axial vs. radial: Two GeForce RTX 2070 Super in a ray tracing comparison test
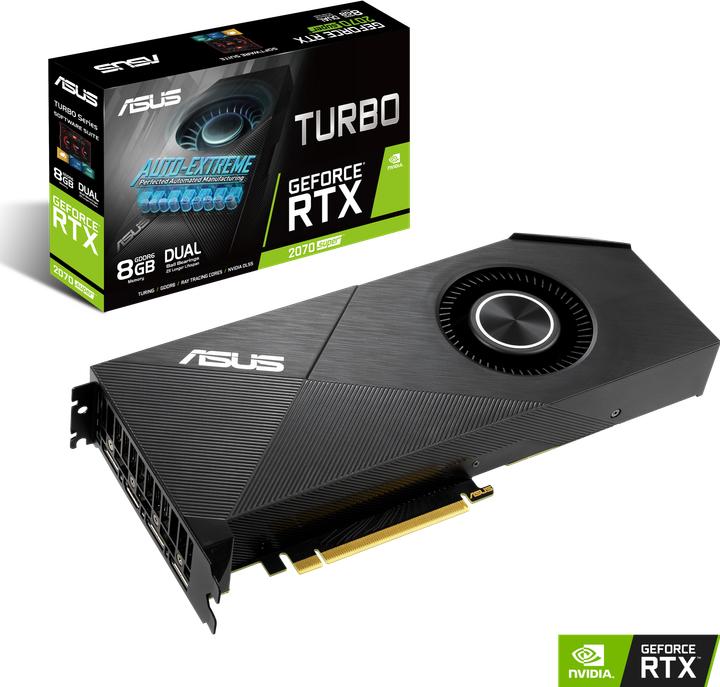
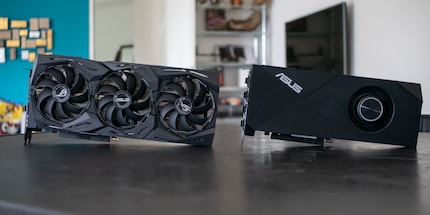
Two GeForce RTX 2070 Super compete against each other: The gamer model, the Asus GeForce ROG Strix RTX 2070S, and the model for systems with limited airflow, the Asus Turbo GeForce RTX 2070 Super Evo. The first part of the two-part review focuses on temperature, noise and performance tests with ray tracing.
The GeForce RTX 2070 Super was launched on 9 July 2019. It is not an overclocked version of the regular 2070 and does not even have the same chip as the GeForce RTX 2080. The two Asus cards tested have the same chip, but rely on their own board design and cooling. The Strix gamer model comes with factory overclocking. Both graphics cards are compatible with Microsoft's new DirectX 12 Ultimate programming interface. According to Nvidia, this means they are already equipped for all new and improved functions of upcoming games. Currently, only Nvidia's RTX graphics cards offer support for DirectX 12 Ultimate.
The cards are tested on our DimasTech Easy V3.0 benchtable with the following components:
Facts and features
Since the GPU codenamed TU106 is already fully activated in the regular GeForce RTX 2070, the GeForce RTX 2070 Super uses the TU104 GPU. The card has around eleven per cent more Cuda, RT, Tensor cores and texture units than the regular 2070.
| Asus GeForce ROG Strix RTX 2070S | Asus Turbo GeForce RTX 2070 Super Evo | Nvidia GeForce RTX 2070 Super | Nvidia GeForce RTX 2070 | |
|---|---|---|---|---|
| Chip | TU104 | TU104 | TU104 | TU106 |
| CUDA cores | 2560 | 2560 | 2560 | 2560 |
| Tensor cores | 320 | 320 | 320 | 288 |
| Texture units | 160 | 160 | 160 | 144 |
| ROPs | 64 | 64 | 64 | 64 |
| RT cores | 40 | 40 | 40 | 36 |
| Base clock | 1635 MHz | 1605 MHz | 1605 MHz | 1410 MHz |
| Boost clock | 1935 MHz | 1770 MHz | 1770 MHz | 1620 MHz |
| Memory | 8GB GDDR6 (14 Gbps, 256-bit, 496 GB/s) | 8GB GDDR6 (14 Gbps, 256-bit, 496 GB/s) | 8GB GDDR6 (14 Gbps, 256-bit, 448 GB/s) | 8GB GDDR6 (14 Gbps, 256-bit, 448 GB/s) |
| TDP | 215 watts | 215 watts | 215 watts | 175 watts |
These two cards differ not only externally, but also in terms of clock frequency.
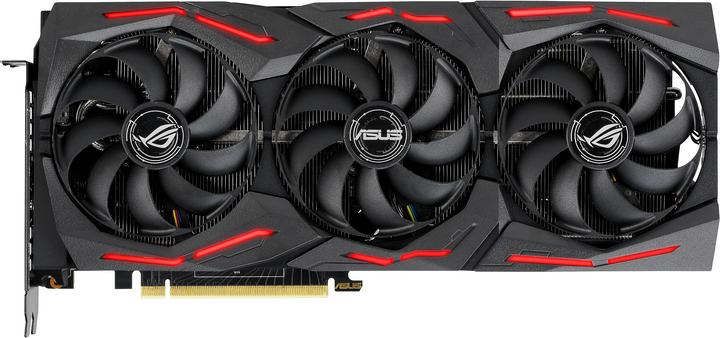
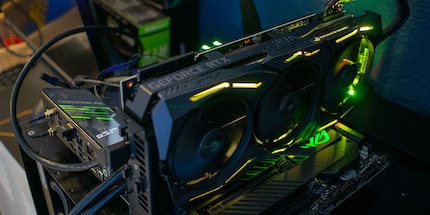
The Strix is part of the "Republic of Gamers" series. In terms of design, the card is aimed at gamers: RGB accents on the fans, ROG lettering on the front and the ROG logo on the aluminium backplate. Otherwise, the Strix is kept plain black.
The Turbo is also black. But that's it for the design similarities. Only a narrow RGB bar adorns the card. A backplate is missing. The Turbo is typical for a card with radial fans: it is completely closed, with fan slots only at the connections.
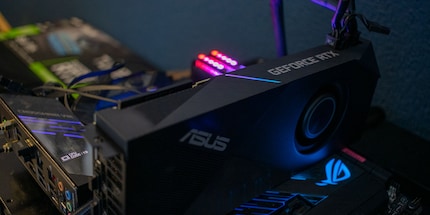
Radial fans draw in air parallel to the drive axis, deflect it by 90° and blow it out. The advantage of this type of fan for graphics cards is that the hot air generated when cooling the card is transported directly out of the housing. Graphics cards with radial fans are therefore also suitable for systems with limited airflow, such as small cases.
The disadvantage of such fans is that they are louder than axial fans. An 80-millimetre radial fan with double ball bearings is installed in the Turbo. According to Asus, this is more durable than a sleeve bearing. The manufacturer has raised part of the cover surrounding the fan. This is intended to create a buffer that guarantees the air flow even in tight spaces. This does not play a role in the test setting: the two cards can draw in air unhindered.
In contrast to the Turbo, the Strix has three 90-millimetre axial fans. These blow air in and out parallel to the axis of rotation of the impeller. The disadvantage of these fans is that they do not transport the warm air generated by cooling directly out of the housing. But they are quieter.
At 29.97 x 13.04 x 5.41 centimetres, the Strix is considerably larger than the Turbo at 26.8 x 11.3 x 4 centimetres. The Turbo only needs two slots, whereas the Strix needs three.
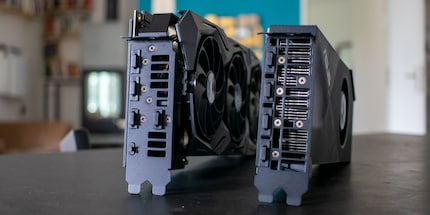
In terms of connectivity, the Strix has two Display Port 1.4a ports, two HDMI 2.0 ports and a Virtual Link port. This is essentially a USB-C port that can be used to supply a VR headset with power and data using just one cable. The Turbo has one HDMI 2.0 and three DisplayPort 1.4 ports
The Turbo is connected via an 8-pin and a 6-pin PCIe cable. The Strix requires two 8-pin PCIe cables.
Synthetic gaming benchmarks, volume and temperatures
Here are the results of the Time Spy and Fire Strike benchmarks:
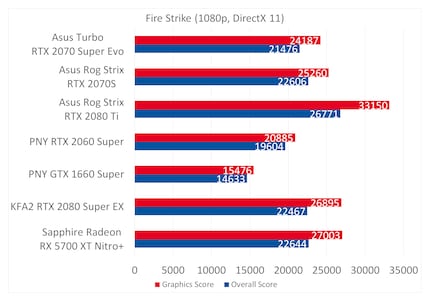
As expected, the Strix beats the Turbo due to its higher clock speed. However, I wouldn't have thought that the result would be so clear-cut. In Time Spy, the card performs five per cent better. In the 2160p benchmark Time Spy Extreme, it's even around six per cent. The DirectX benchmark Fire Strike is similar: the Strix is around five per cent faster when tested at 1080p and around six per cent faster at 2160p.
Here are the results in detail:
Asus Turbo GeForce RTX 2070 Super Evo: Synthetic benchmarks
| Benchmark | Overall Score | Graphics score and average FPS in Graphics Test 1 and 2 | Combined Score average FPS |
|---|---|---|---|
| Fire Strike
(1080p, DirectX 11) | 21 476 | 24 187
116.42 / 95.89 | 9656
44.91 |
| Fire Strike Ultra
(2160p, DirectX 11) | 6004 | 5749
32.47 / 20.32 | 3255
15.14 |
| Time Spy
(1440p, DirectX 12) | 10 008 | 9781
62.62 / 56.99 | n/a |
| Time Spy Extreme
(2160p, DirectX 12) | 4818 | 4601
28.95 / 27.25 | n/a |
Asus GeForce ROG Strix RTX 2070S: Synthetic benchmarks
| Benchmark | Overall Score | Graphics score and average FPS in Graphics Test 1 and 2 | Combined Score average FPS |
|---|---|---|---|
| Fire Strike
(1080p, DirectX 11) | 22 606 | 25 260
121.50 / 100.20 | 10 804
50.26 |
| Fire Strike Ultra
(2160p, DirectX 11) | 6342 | 6078
34.41 / 21.45 | 3432
15.97 |
| Time Spy
(1440p, DirectX 12) | 10 473 | 10 271
65.11 / 60.38 | n/a |
| Time Spy Extreme
(2160p, DirectX 12) | 5072 | 4876
30.50 / 29.02 | n/a |
Raidall fans are louder. What about the sound level? During the Time Spy benchmark, I measured around 42 dB on the Strix with the [Testo Sound Level Meter 815 31.5 from a distance of 30 centimetres. With the Turbo it was 49 dB. The fans were set to automatic in each case.
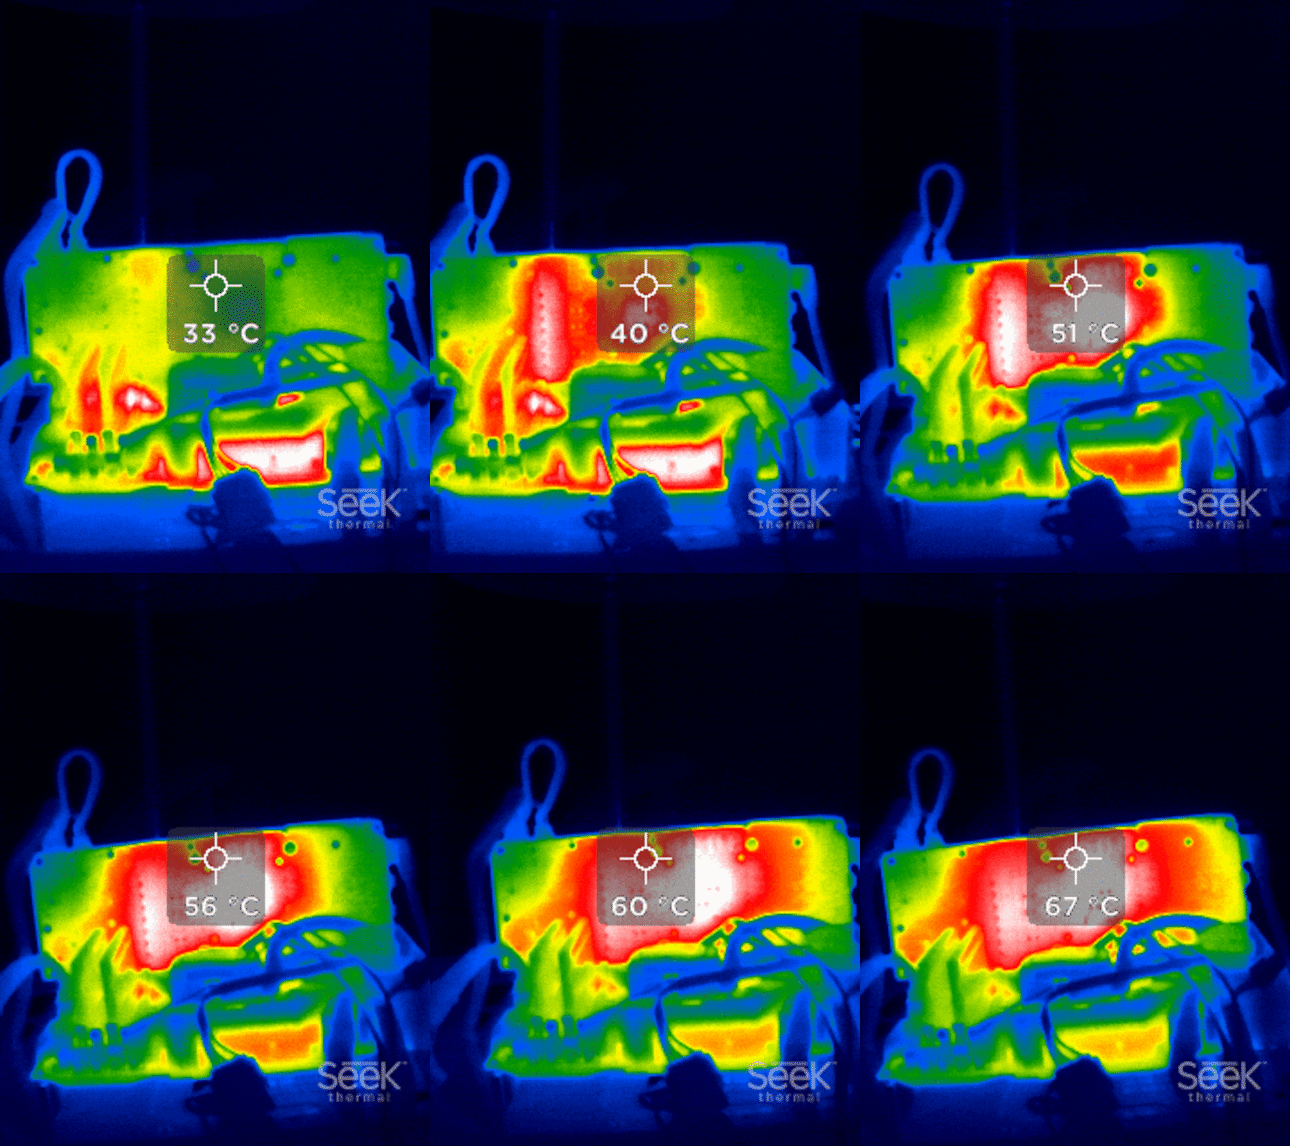
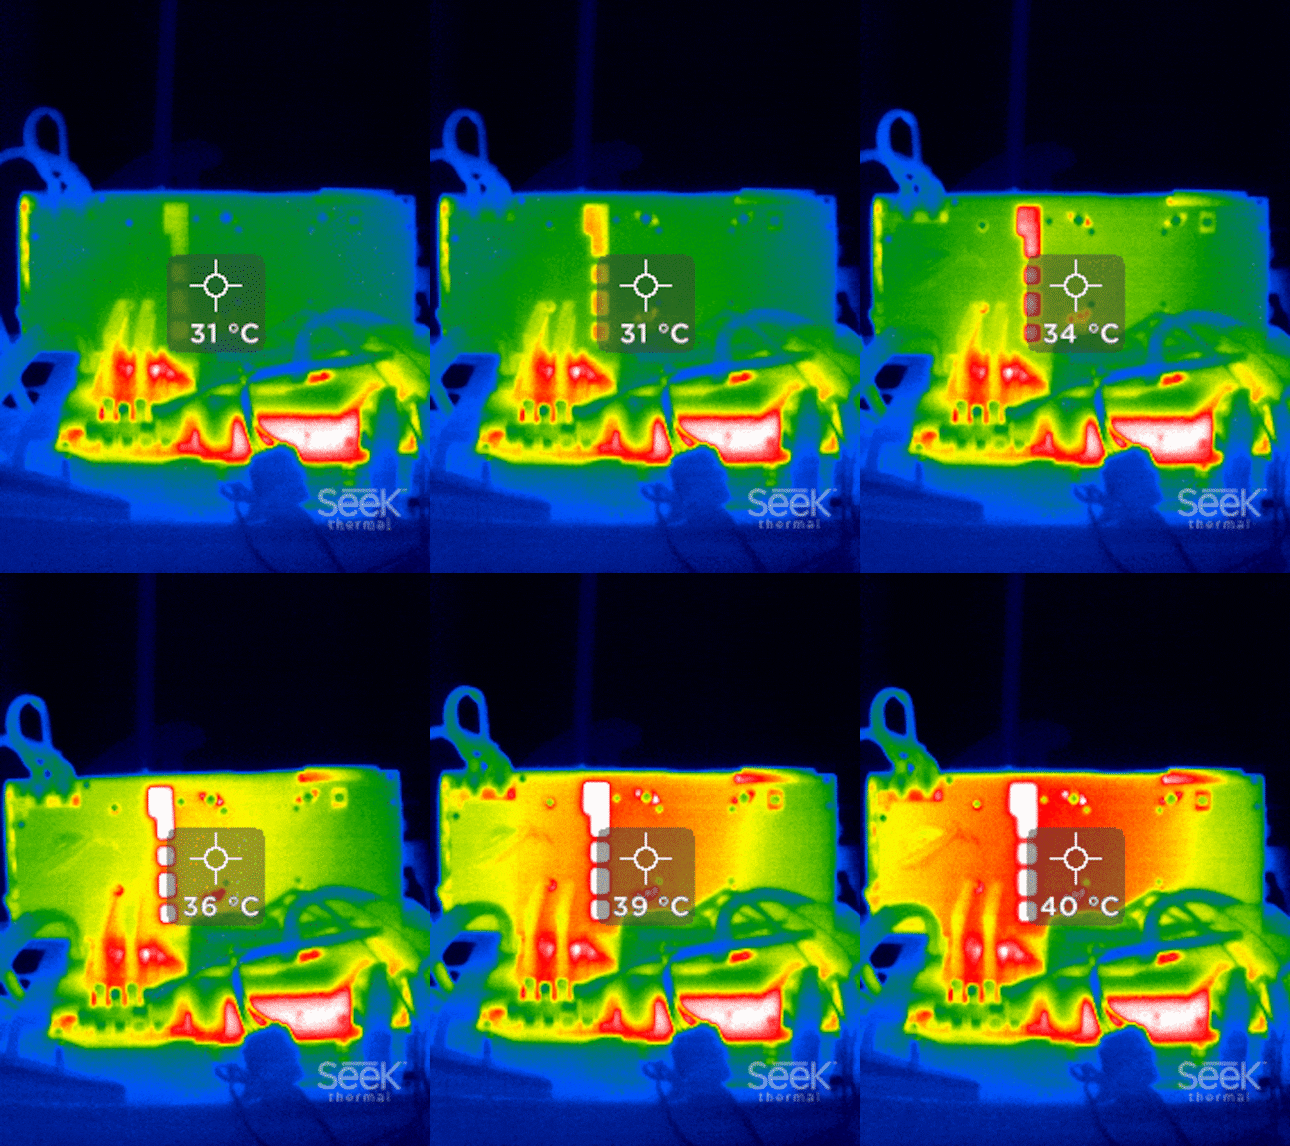
The Strix reached a maximum temperature of 62° Celsius. The average was 59° Celsius. The Turbo was significantly warmer: 82° Celsius at maximum and 78° Celsius on average. This clearly shows the difference between the three axial fans of the Strix and the one radial fan of the Turbo. The comparison on the open test bench is somewhat unfair for the Turbo. In a closed case and taking into account the temperatures of the CPU, mainboard and other components, the Turbo would probably not perform quite as badly.
Here are the temperature developments of the two cards during the approximately two-minute Time Spy demo, recorded with the thermal imaging camera (left: Turbo, right: Strix):
When I turn up the fans on the two cards, they both roar loudly: I measured 62 dB on the Strix. But that's nothing compared to the Turbo: I measured 71 dB. It sounds and looks like this (from 25 per cent to 100 per cent fan speed):
The pressure that the Turbo builds up is blatant. If I still had the same hair I had twenty years ago, my mane would be storm-styled - even Three Weather Taffeta wouldn't help.
If I run the Time Spy benchmark with the fans set to 100 per cent, I get a score of 10,500 points with the Strix and 10,144 with the Turbo. The performance difference here is "only" 3.5 per cent. The temperature difference is also significantly lower: the Strix reaches a maximum of 51° and an average of 49° Celsius and the Turbo a maximum of 54° and an average of 52°. The Turbo therefore seems to clock down when the fans are set to automatic speed.
To get a better indication of the cooling performance of the cards, I test them normalised by volume. I lower the percentage output of the fans step by step until I measure 40 dB at a distance of 30 centimetres. This means that the Strix fans are running at 40 per cent of their maximum power. We humans consider 40 dB to be quiet. If I drive Time Spy like this, I achieve a score of 10 420 points. This corresponds to a performance loss of around half a per cent. The maximum temperature of the card is 64° Celsius, the average is 60° Celsius.
In order to get the Turbo down to 40 dB, I have to turn the fan speed down to 25 per cent of maximum performance. This gives me a score of 9372 in Time Spy, which corresponds to a drop in performance of around seven per cent. That's enormous. At a maximum of 87° and an average of 86° Celsius, the card has definitely clocked down. The card reached this maximum value much faster than when tested with automatic speed.
Nvidia ray tracing and DLSS in "Wolfenstein: Youngblood"
The cards in Nvidia's RTX series all have ray tracing cores. These make it possible to play games in real-time ray tracing. You can find out exactly what ray tracing is at the following link
Raytracing had a hard time establishing itself in the beginning. Nowadays, more and more games support the feature. Minecraft is also the driving force that the technology needs to finally establish itself.
In addition to ray tracing, the RTX series brings another feature: DLSS. The abbreviation DLSS stands for Deep Learning Super Sampling and is a graphics technology from Nvidia that uses AI algorithms to improve gaming performance. It is a type of upscaling technology in which the image is calculated in a lower resolution and then upscaled by the AI algorithms.
Nvidia has consistently developed DLSS further and recently released version 2.0. Since "Wolfenstein: Youngblood" has two benchmarks, I test various settings with both cards with ray tracing enabled and disabled as well as DLSS enabled and disabled in 1440p. Why 1440p? Because the GeForce RTX 2070 Super is ideally suited for gaming in this resolution. In "Wolfenstein: Youngblood", reflections are rendered with ray tracing. The "Riverside" benchmark simulates an outdoor scenario, while the "Lab X" benchmark simulates an indoor scenario.
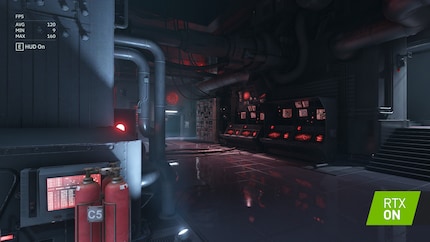
I also activate the highest presets setting "My life!". I deactivate Vertical Sync and Motion Blur. I use TSSAA (8TX) with DLSS deactivated. I run the benchmarks three times each and enter the average FPS value.
With ray tracing enabled and DLSS on the "Quality" setting, I achieved an average of 106 FPS in the Riverside benchmark and 115 FPS in the Lab X benchmark on the Strix. With the same settings, the Turbo achieved 101 and 110 FPS. That's five FPS less in each case.
I deactivate DLSS and run both benchmarks with the cards again. The drop in FPS is enormous: I only achieve 74 FPS with the Strix in the Riverside benchmark and 81 FPS with the Lab X. I get the same values with the Turbo. For the Strix, that's around 30 per cent less FPS than with DLSS enabled. For the Turbo, it's 26 and 20 per cent respectively.

I deactivate ray tracing and DLSS on both cards. With the Turbo, I achieve 140 in the Riverside benchmark and 168 FPS in Lab X. With the Strix, it's 144 in Riverside and 174 in Lab X. This shows that ray tracing is damn performance-hungry. The maximum FPS loss on the Strix is 114 per cent.
The great thing about DLSS is that I can use it not only when ray tracing is activated, but also otherwise. I run the benchmarks with ray tracing deactivated and DLSS activated with the "Quality" setting. With the Strix, I achieve 165 in the Riverside benchmark and 192 FPS in Lab X. With the Turbo, I also achieved 192 FPS in the Lab X benchmark and 163 FPS in Riverside. This corresponds to an FPS increase of 12.5 to 15 per cent for the Strix. It's even clearer with the Turbo.
Interim conclusion: Strix has the edge
The Strix not only performs better in synthetic benchmarks, but also in gaming. However, the difference in gaming is not as great as in the synthetic benchmarks. The Strix is clearly ahead in terms of cooling performance and noise emissions.
So far, everything speaks in favour of the Strix. In the second part, the two cards compete against each other in the application benchmarks of the Adobe Suite, Blender and Da Vinci Resolve as well as games.
From big data to big brother, Cyborgs to Sci-Fi. All aspects of technology and society fascinate me.
